
Performance opérationnelle
Retrouvez les principaux indicateurs opérationnels du groupe EDF, en lien avec la production d’électricité, les volumes acheminés et les données clients. Ces informations permettent de suivre l’activité du Groupe et d’éclairer sa performance globale.
-

162,0 TWh
Production nucléaire à fin mai 2026 - France
-

14,1 TWh
Production nucléaire à fin mai 2026 - Royaume-Uni
-

20,7 TWh
Production hydraulique à fin mai 2026 - France
-

41,1 millions
Clients du Groupe en 2025
-

96,9 TWh
Volumes acheminés par Enedis au T1 2026
Production nucléaire
La production nucléaire constitue un indicateur clé de la performance industrielle d’EDF. Cette rubrique présente les données de production en France et au Royaume-Uni, afin de suivre l’évolution du parc et sa contribution au mix de production du Groupe.
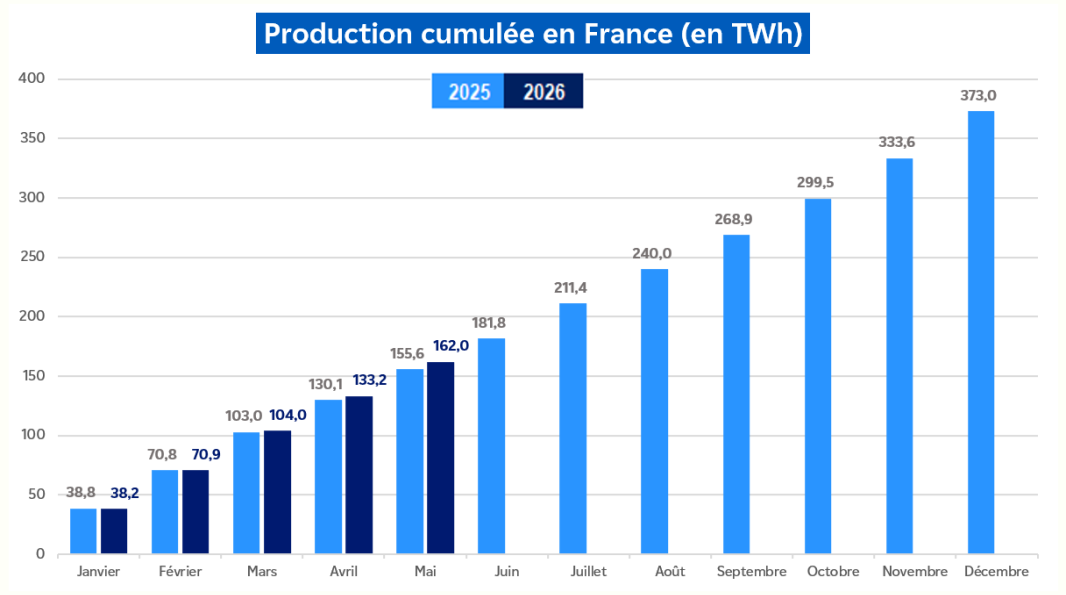
La production du mois de mai 2026 s'établit à 28,8 TWh, plus élevée de 3,2 TWh vs mai 2025.
Depuis le début de l'année, la production cumulée s'élève à 162,0 TWh, soit +6,4 TWh par rapport à 2025. Ceci s'explique par un déroulement du début de la campagne d'arrêts de tranches 2026 conforme aux prévisions, ainsi que par une bonne disponibilité des tranches en fonctionnement.
Transcription
Production nucléaire cumulée en France en TWh, 2025 et 2026
Janvier
- 2026 : 38,2
- 2025 : 38,8
Février
- 2026 : 70,9
- 2025 : 70,8
Mars
- 2026 : 104,0
- 2025 : 103,0
Avril
- 2026 : 133,2
- 2025 : 130,1
Mai
- 2026 : 162,0
- 2025 : 155,6
Juin
- 2025 : 181,8
Juillet
- 2025 : 211,4
Août
- 2025 : 240,0
Septembre
- 2025 : 268,9
Octobre
- 2025 : 299,5
Novembre
- 2025 : 333,6
Décembre
- 2025 : 373,0
| Mai 2025 | Mai 2026 | Évolution | |
|---|---|---|---|
| Production mensuelle | 25,5 TWh | 28,8 TWh | 12,9 % |
| Production cumulée | 155,6 TWh | 162,0 TWh | 4,1 % |
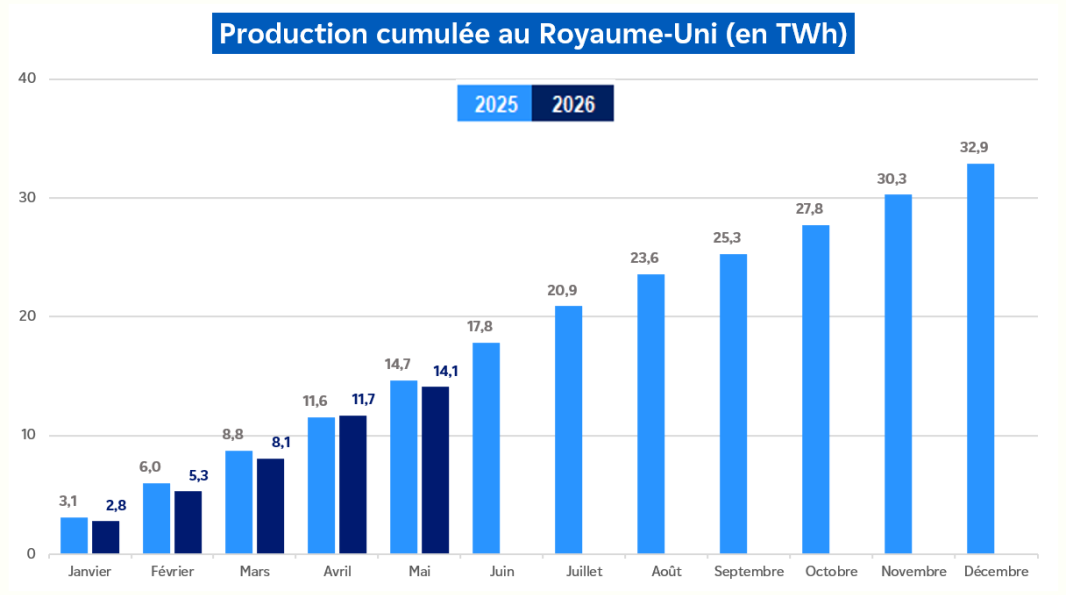
La production du mois de mai 2026 s'établit à 2,4 TWh, en baisse de 0,7 TWh vs mai 2025.
La production cumulée est de 14,1 TWh, soit -0,6 TWh par rapport à la même période en 2025, en raison d'arrêts fortuits plus nombreux en 2026.
Transcription
Production nucléaire cumulée au Royaume-Uni en TWh, 2025 et 2026
Janvier
- 2026 : 2,8
- 2025 : 3,1
Février
- 2026 : 5,3
- 2025 : 6,0
Mars
- 2026 : 8,1
- 2025 : 8,8
Avril
- 2026 : 11,7
- 2025 : 11,6
Mai
- 2026 : 14,1
- 2025 : 14,7
Juin
- 2025 : 17,8
Juillet
- 2025 : 20,9
Août
- 2025 : 23,6
Septembre
- 2025 : 25,3
Octobre
- 2025 : 27,8
Novembre
- 2025 : 30,3
Décembre
- 2025 : 32,9
| Mai 2025 | Mai 2026 | Évolution | |
|---|---|---|---|
| Production mensuelle | 3,1 TWh | 2,4 TWh | 23,1 % |
| Production cumulée | 14,7 TWh | 14,1 TWh | -3,9 % |
Production hydraulique
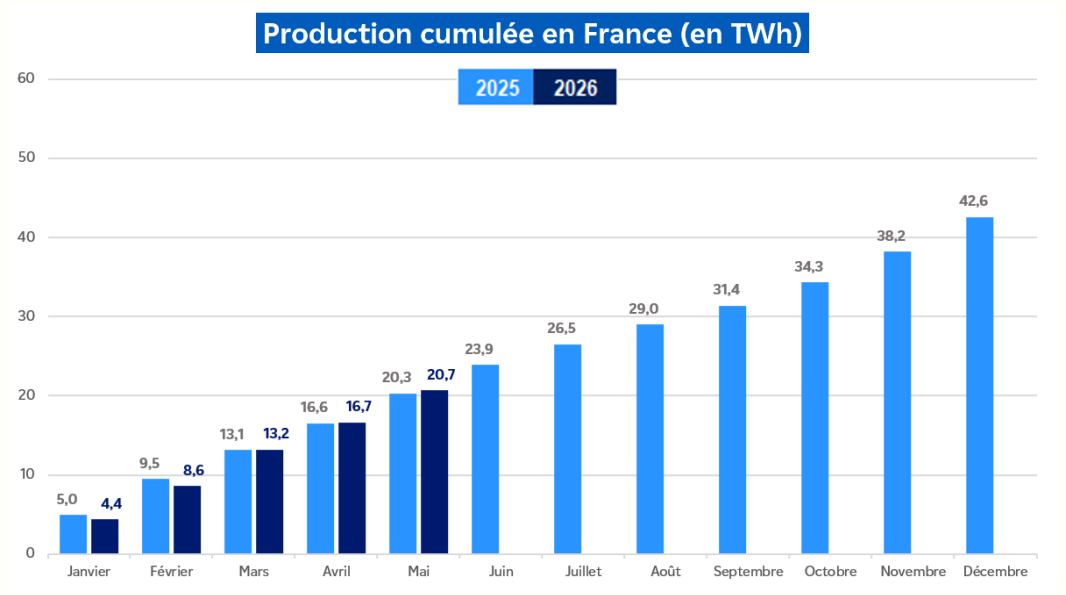
La production hydraulique contribue à l’équilibre du mix électrique d’EDF grâce à une énergie renouvelable, pilotable et flexible. Cette rubrique présente les indicateurs de production en France, en distinguant les données mensuelles et cumulées pour suivre l’évolution de l’activité hydraulique.
Transcription
Production hydraulique cumulée en France en TWh, 2025 et 2026
Janvier
- 2026 : 4,4
- 2025 : 5,0
Février
- 2026 : 8,6
- 2025 : 9,4
Mars
- 2025 : 13,1
- 2026 : 13,2
Avril
- 2025 : 16,5
- 2026 : 16,7
Mai
- 2026 : 20,7
- 2025 : 20,3
Juin
- 2025 : 23,9
Juillet
- 2025 : 26,5
Août
- 2025 : 29,0
Septembre
- 2025 : 31,4
Octobre
- 2025 : 34,3
Novembre
- 2025 : 38,2
Décembre
- 2025 : 42,6
| Mai 2025 | Mai 2026 | Évolution | |
|---|---|---|---|
| Production mensuelle¹ | 3,8 TWh | 4,1 TWh | 7,5 % |
| Production cumulée² | 20,3 TWh | 20,7 TWh | 1,9 % |
(1) Production hydraulique hors activité insulaire avant déduction de la consommation du pompage
(2) Production cumulée après déduction du pompage : 16,8 TWh en 2025 et 16,7 TWh en 2026
Données d’acheminement
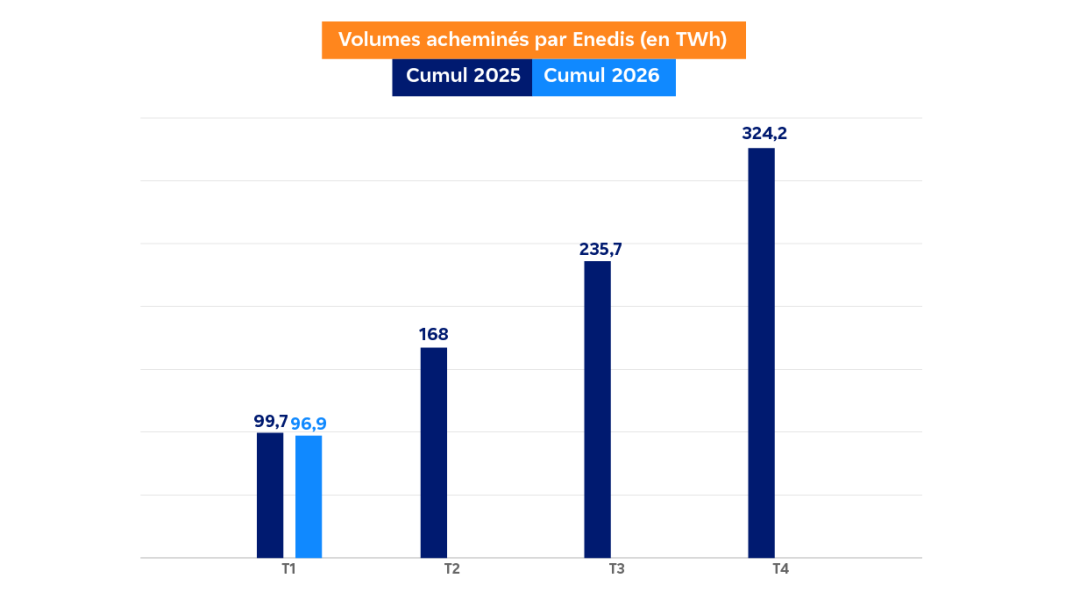
Cette rubrique présente les principaux indicateurs liés à l’acheminement de l’électricité. Elle permet de suivre les volumes acheminés par Enedis.
Transcription
Volumes acheminés par Enedis (en TWh)
Premier trimestre
- 99,7 TWh en 2022
- 96,9 TWh en 2026
Second trimestre
- 168 TWh en 2025
Troisième trimestre
- 235,7 TWh en 2025
Quatrième trimestre
- 324,2 TWh en 2025
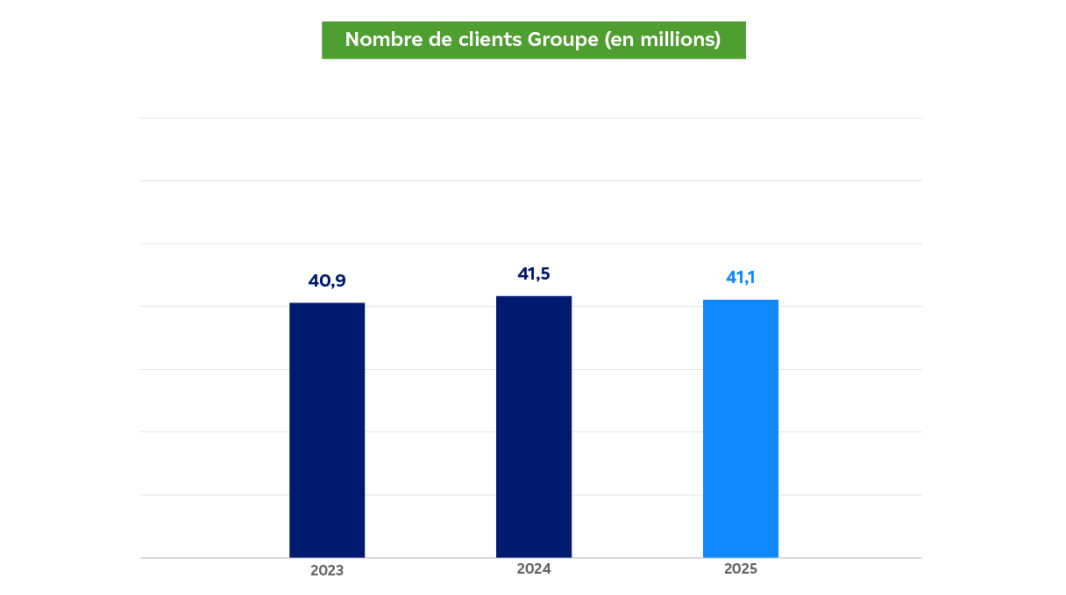
Clients du Groupe
Cette rubrique présente les principaux indicateurs liés à la clientèle d’EDF. Elle permet de suivre l'évolution du nombre total de clients du Groupe sur 3 années.
En 2025, le nombre de clients s'élève à 41,1 millions, essentiellement dans les pays du G4 (France, Grande Bretagne, Italie et Belgique).
Le portefeuille de clients est constitué de contrats électricité, gaz et services récurrents.
Transcription
Nombre de clients Groupe (en millions)
- 2023 : 40,9
- 2024 : 41,5
- 2025 : 41,1