July 2024
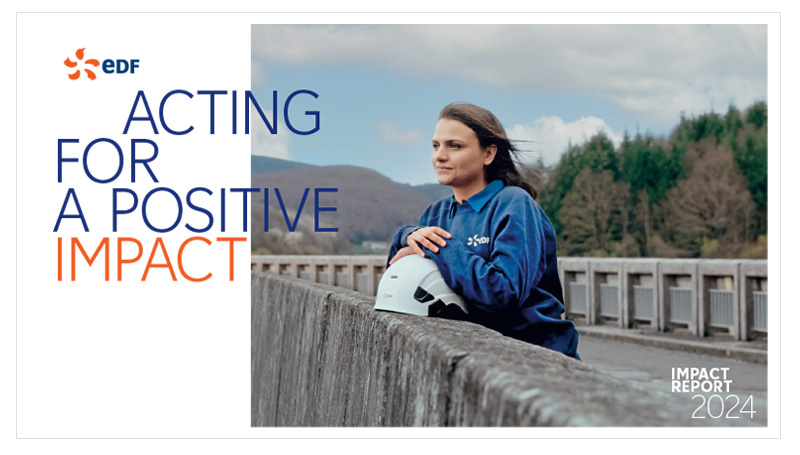
Acting for a positive impact
Following the first edition in 2021, this new impact report describes the progress made by EDF Group and opens up perspectives on how we can pursue our transition towards a world of electricity that is fair, inclusive and sustainable.
-
Download the EDF group impact report 2024 PDF - 6.87 MB
Progress with our impact
What progress has been made since the first impact report 2021?
Performance measured between EDF Group indicators for 2021 and 2023.
Carbon neutrality and climate
-
– 29.3%
for scope 1 and 2 GHG emissions
-
– 29.4%
for scope 3 CO₂ emissions
-
+ 17.4%
for investments made in line with our carbon-neutral trajectory
-
– 22.9%
for the carbon intensity of specific CO₂ emissions from the production of electricity and heat
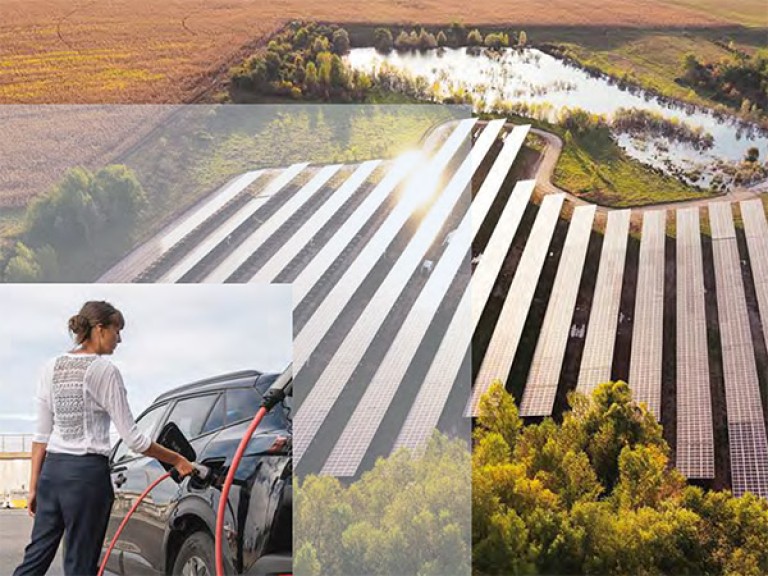
How can we reconcile electrification of uses with planetary boundaries?
EDF, the world’s leading producer of electricity without direct CO₂ emissions, is a driving force in low-carbon energy value chains. By stepping up its production of low-carbon electricity and promoting reduced consumption, EDF is responding to the imperative need to keep human activity within planetary boundaries while helping to combat climate change. In line with the Paris Agreement, the Group is comitted to achieve net zero emissions by 2050. Because decarbonising energy is a systemic challenge, EDF wants to involve all its stakeholders in finding the right balance between increasing electricity needs and the environmental boundaries needed to preserve the planet. The Group is committed to decarbonising the energy mix, electrifying uses and promoting reduced consumption to create a resilient and sustainable energy model.
Preserving the planet’s ressources
-
97%
Volume of freshwater withdrawn and returned to nature. Stable vs 2021
-
– 3.49%
Reduction in water intensity since 2021, down to 0.83 l/kWh. –0.03 l/kWh vs 2021
-
10%
Natural uranium saved each year by reusing recycled radioactive waste. Stable vs 2021
How can we operate while conserving and restoring ecosystems?
Conservation of natural resources is not a choice: it is a necessity for the sustainability of human activities that are closely linked to the state of nature.
EDF Group undertakes to place conservation of nature at the heart of its raison d’être. This ambition is all the more crucial given that the company, with its active generation and distribution sites or those undergoing conversion, as well as its land reserves, manages some 46,000 hectares of land and water reservoirs. The Group thus has a responsibility to take action and step up its efforts in favour of the living world. The issues involved in conserving natural resources concern both existing and future projects, and are complex and long term. This is why EDF incorporates biodiversity issues into each of its projects, minimising the environmental footprint and promoting the resilience of ecosystems, while ensuring the sustainable management of its land assets. The Group also invests in research to play an active role in finding ways to restore natural areas.
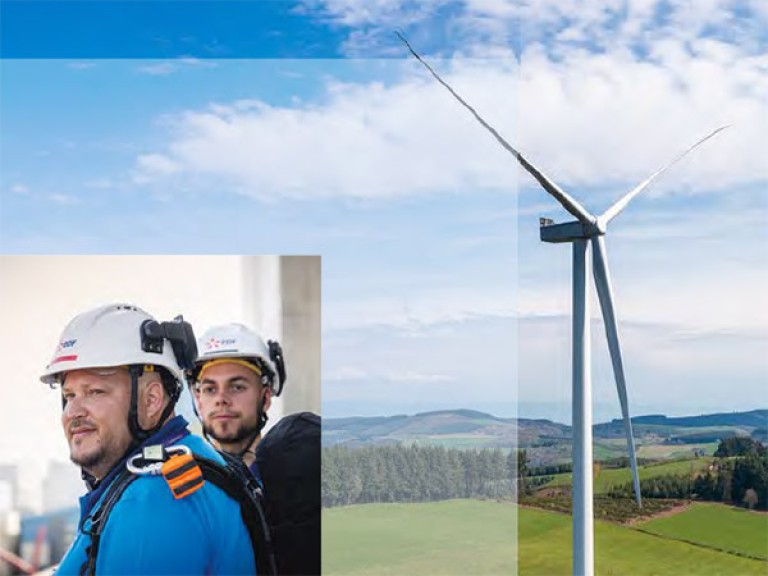
Well-being and solidarity
-
+15.1%
in investments in projects by the EDF Group Foundation (€5.3m invested in 2023)
-
+2.79%
direct and indirect jobs induced (332,000 jobs in 2023)
-
+1.7%
in employees having benefited from a skills development initiative (i.e. 80.7% of employees trained)
-
+11%
in work-study trainees taken on (8,894 trainees in 2023)
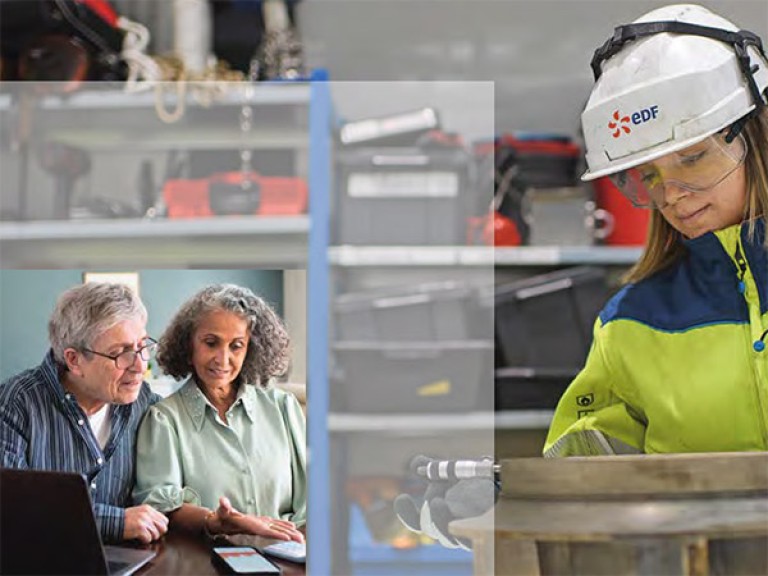
Which model for a fair and inclusive transition?
EDF Group is convinced that the energy transition must be accompanied by an in-depth discussion of a more inclusive model of society. True to its values of responsibility and solidarity, the Group is committed to considering the expectations of all its stakeholders, both internal and external. For its employees, it has defined a social protection policy guided by the principles of responsibility and balance between competitiveness and sustainability. Offering them an inclusive working environment, making jobs more attractive and maintaining a high level of social dialogue are all ways to boost performance and retain talented individuals. The same principles of responsibility and solidarity apply to the Group’s external stakeholders: EDF helps its customers to control their energy consumption and is proactively committed to combating fuel poverty. In addition to individual support, EDF also develops community programmes and partnerships to promote universal access to electricity.
Responsible development
-
97%
of employees at sites that have closed down have found in-house jobs (Fessenheim and Le Havre power plants)
-
+700
Employees were redeployed in house between 2021 and 2023
-
+33.4%
of suppliers take advantage of reverse factoring⁽¹⁾, i.e. 743 suppliers
-
+7.6%
increase in productivity within EDF through productivity partnerships (€59.4m)
⁽¹⁾ Reverse factoring offers EDF suppliers the possibility of pre-financing their invoices before the contractual payment date via a factoring company.
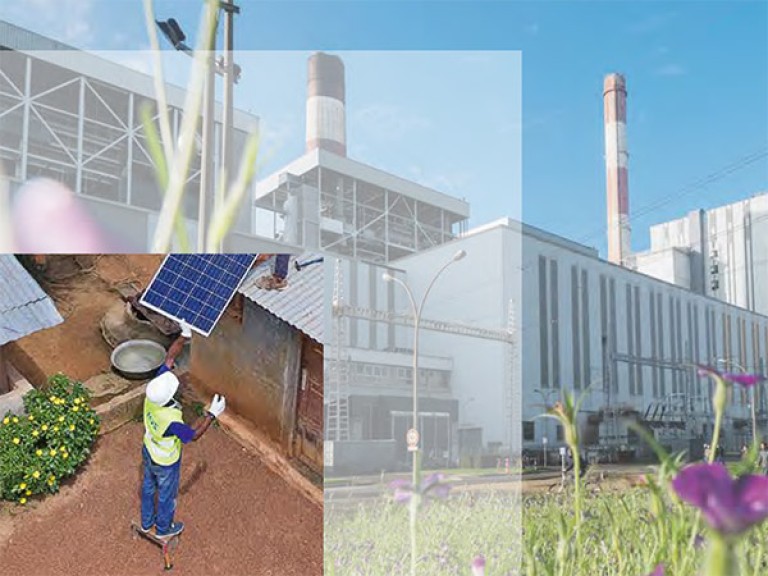
How can value be shared more effectively with the regions?
For EDF, deployment of a new energy model must be in the interest of responsible development and must benefit all its stakeholders. Committed to making energy accessible, the Group is tackling the challenges of low-carbon electrification of isolated areas, such as islands, and access to energy in developing regions. The value created is really worthwile only if shared by all, so the Group is committed to developing and maintaining a high level of dialogue with all its stakeholders. This enables it to play an active part in the social and economic development of the regions in which it operates. By working closely with regional institutions, companies and residents, EDF helps to create jobs, support local initiatives and promote renewable energies in the regions. The Group also invests in sustainable infrastructure and educational programmes to build local capacity, thus promoting inclusive and sustainable growth. This integrated approach ensures that everyone benefits from the energy transition, while strengthening the resilience of communities and supporting balanced and equitable economic development.
Some publications to go further
Find out an expanded list of publications at the end of EDF Group's impact report 2024.
-
Download the EDF Group's impact report 2021PDF - 1.65 MB
For this first report, the positive and negative impacts of EDF’s activities and actions are put into perspective by the Group's stakeholders. They share out their views respect to the way EDF can help contemplating the transition required all over the world.
April 2021 edition - 30 pages
-
Download the leaflet "How EDF is adapting to climate change"PDF - 9.97 MB
For too long, addressing the topic of adaptation has been seen as giving up on fighting climate
change, or at least as a distant issue. With this first publication on adaptation to climate change, the EDF group is guided by three key aims: understand, inform, act.July 2024 edition - 31 pages
-
Download the 2023 e-book "A divided planet? World opinion on climate change"PDF - 1.96 MB
Obs'COP represents an international report on opinions, knowledge, expectations and commitment levels with regard to climate change, to support reflection on the subject and contribute to the constructive search for future solutions. This summary document of the key findings of this 2023 wave notably includes a new theme: climate migrations.
November 2023 edition - 36 pages